
TL;DR
The 2025 Rate Optimization Insights on Google Cloud Compute provides benchmarking insights and strategic guidance for FinOps practitioners looking to optimize Google Cloud compute costs. We analyzed over $250M in annualized compute usage and identified key trends in Effective Savings Rate (ESR), utilization of Committed Use Discounts (CUDs), rate optimization strategies, and more.
- Optimizing compute services (Compute Engine, GKE, and Cloud Run), which often make up most of the average Google Cloud bill, has the greatest impact on cost.
- A dual strategy that uses CUDs and private rates achieves the highest ESR, yet 40% of companies analyzed do not use any CUDs.
- A diversified portfolio of CUD instruments improves ESR outcomes, but most companies rely on a single type, with 1-year resource-based CUDs being the most popular.
- Low spenders (by annual compute usage) achieve a median ESR of 9.4%, likely due to limited access to private rates, minimal or no CUD usage, low coverage, and/or resource constraints.
- High spenders typically achieve higher ESRs by investing in FinOps practices and adopting diversified portfolios. However, maintaining optimal ESR and flexibility at scale requires automation to manage risk and adjust to changes in usage.
- Automating an adaptive ladder of resource-based CUDs and spend-based FCUDs reduces manual effort and risk while delivering world-class ESR performance. This is especially important as cloud environments and FinOps responsibilities grow more complex.
Introduction
Google Cloud is one of the fastest-growing cloud providers with revenues growing 31% from 2023 to 2024 (source: Alphabet 10-K), higher than AWS’s growth of 19% during the same period (source: Amazon 10-K). Compute services, including Compute Engine, Google Kubernetes Engine (GKE), and Cloud Run, comprise a significant portion of the average Google Cloud bill.
This report analyzes usage of Google services that can be discounted with CUDs (labeled “CUDable” services). We found that compute-related services contribute to 73% of the total CUDable usage. This far outweighs BigQuery and Cloud SQL, which represent only 11% and 12%, respectively. As a result, optimizing Google Cloud compute services can significantly impact your cloud costs.

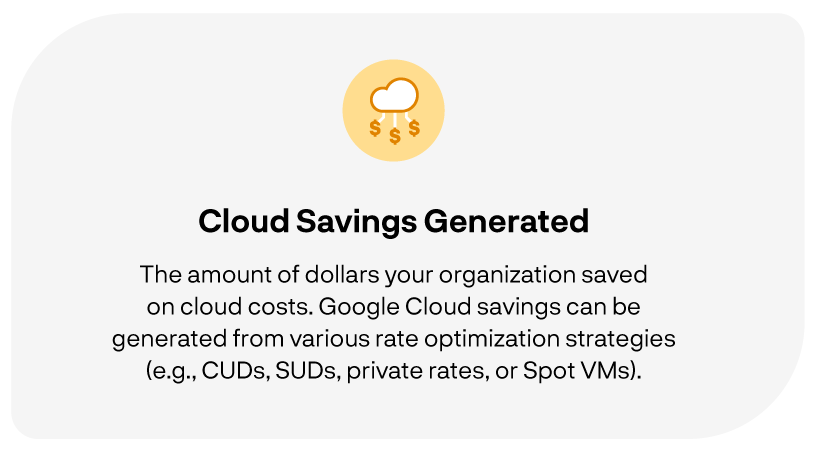
Teams employ rate optimization to manage and adjust how they pay for cloud services. Rate optimization helps FinOps teams extract the most value from their cloud investments. By analyzing current and historical data from the Detailed Usage Cost Billing Export, FinOps teams can realize savings through the use of Committed Use Discounts (CUDs), private rates, Sustained Use Discounts (SUDs), and/or other pricing models, such as Spot VMs.
This report provides benchmarking data, background, and insights to help guide and improve your rate optimization strategy for Google Cloud compute services. In it, you will find information about Google Cloud Effective Savings Rate (ESR), coverage, usage of different types of CUD instruments, and more.
Key Statistics
Average percent of CUDable Google Cloud usage comprised of compute services (Compute Engine, GKE, Cloud Run)
Percent of Google Cloud Billing Accounts that do not use CUDs
Median Compute Effective Savings Rate (ESR) for companies using CUDs and private rates
Percent of Google Cloud Billing Accounts that use 1-year resource-based CUDs
Median Compute Coverage of companies with low compute usage (<$500K Annually)
Median Compute Effective Savings Rate (ESR) of those with high compute usage ($10M+ Annually)
How Google Cloud Pricing Works For Compute
On AWS, companies can leverage discount instruments such as Reserved Instances and Savings Plans to reduce what they pay for specific cloud services. Similarly, companies can deploy Committed Use Discounts (CUDs) to reduce compute costs on Google Cloud in exchange for a one-year or three-year term. There are two types of CUDs for compute: 1) resource-based CUDs and 2) spend-based Flexible CUDs.
Whereas resource-based CUDs are very specific to minimum levels of Compute Engine resources (including vCPU, memory, GPU, and local SSDs) for a specific machine series in a particular region, spend-based Flexible CUDs, similar to AWS Savings Plans, are based on committing to a level of hourly usage and can float across multiple machine series and regions. Companies can also benefit from Sustained Use Discounts (SUDs), which are automatically applied to Compute Engine resources used consistently (more than 25% of the billing month) when no other CUDs apply.
Companies may also have private rates (also known as negotiated rates). Private or negotiated rates may be lower than on-demand rates—below the List On-Demand Rate—and are often based on several factors, including the company’s negotiating power with Google Cloud. Companies with higher total spend, including all Google services and marketplace, tend to have private rates. Other discounted rates may come from free-tier and promotional credits, which have less impact on pricing compared to CUDs and private rates.
One significant difference between Google Cloud and AWS is how each provider reports their rates. Whereas AWS’ Cost and Usage Report displays discounts in terms of percentages, Google Cloud’s Detailed Usage Cost Billing Export data shows discount rates in dollar terms. For example, you can see the overall discount rate for Compute Engine in dollars per hour for the vCPU of a particular machine series, size, region, etc.
The impact of CUDs and private rates on your costs cannot be measured independently in Google Cloud. If a company has private rates and CUDs applied to the machine series, for example, it is impossible to develop a standardized equation that separates discounts from CUDs versus private rates. In contrast, AWS generally makes the impact of Reserved Instances (RIs) and Savings Plans (SPs) distinguishable from private pricing by allowing discounts to be additive.
This is an exception for some service-specific private pricing agreements that do not allow stacking of RIs. For most standard cross-service private pricing agreements, though, discounts are additive. The AWS Cost and Usage Report (CUR) calculates the discount from Reserved Instances and Savings Plans before applying the discount from private rates. Continue reading about how AWS applies discounts.
In the example below, notice how the EC2 Instance receives a 40% discount from RIs and an additional 33% discount from private rates, resulting in an overall blended rate of $0.40/hour.
| AWS |
| EC2 Instance On-Demand Cost – $1.00/instance hour |
| EC2 Instance Cost with RI (@ 40% discount) – $0.60/instance hour |
| EDP Discount Rate – 33% discount |
| EC2 Instance Net Cost – $0.40/instance hour |
The company pays for a Compute Engine (GCE) instance on Google Cloud. If it does nothing, the Negotiated Rate of $0.70/vCPU hour on-demand applies. If CUDs are leveraged, the company receives a Negotiated CUD Rate at $0.40/vCPU hour, which is better than only using private rates.
However, using CUDs also increases risk; the company must commit to a one-year or three-year term. Before choosing between the Negotiated Rate on-demand and the Negotiated CUD Rate, the company should consider risks and savings outcomes.
| Google Cloud |
| GCE Instance List On-Demand Rate – $1.00/vCPU hour |
| GCE Instance Negotiated Rate – $0.70/vCPU hour |
| GCE Instance List CUD Rate – $0.63/vCPU hour |
| GCE Instance Negotiated CUD Rate – $0.40/vCPU hour |
Given these differences in reporting discount rates, companies should be careful when comparing rate optimization outcome metrics on Google Cloud with outcomes on other clouds. Our report takes these nuances into account when examining the Effective Savings Rate and other key rate optimization metrics.
Effective Savings Rate
Effective Savings Rate (ESR) is a well-established rate optimization metric that accurately measures savings performance. Unlike relying on multiple input metrics (e.g., coverage, utilization, discount rate), ESR measures the ROI from your rate optimization efforts. ESR is calculated using inputs and outputs to provide a clear picture of your impact from rate optimization.
The ESR for Google Cloud compute is calculated as the percentage of cost savings achieved from all rate optimization efforts relative to the List On-Demand Rate or MSRP:

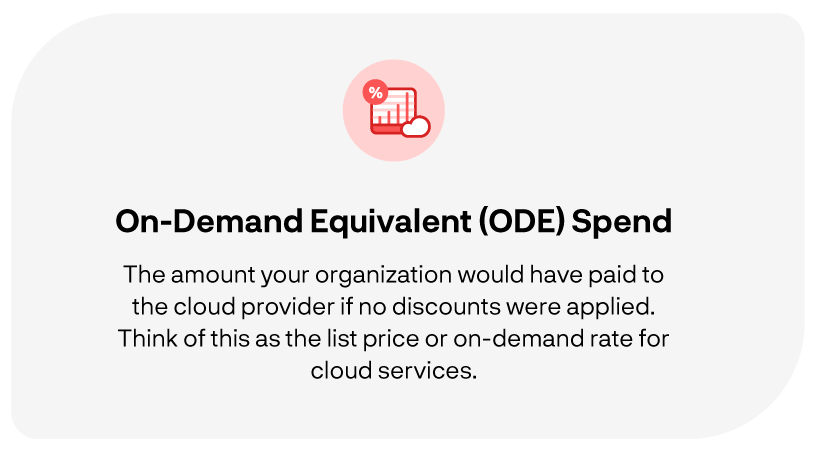
Because Google Cloud reports an all-discounts rate, the ESRs mentioned in this report incorporate the combined impact from CUDs, private pricing, and SUDs. Private rates are usage-dependent and materially impact ESR, so we segment our dataset based on compute usage (in other words, the List On-Demand Rate), to allow for comparison.
Effective Savings Rate has been widely adopted by the FinOps Foundation and vendors, such as ProsperOps, as a core rate optimization KPI. The ProsperOps algorithm is built to maximize ESR. To quantify success, our console measures and displays ESR, allowing users to compare their current ESR to the baseline before subscribing to our autonomous rate optimization service.
Commitment Lock-in Risk – Companion Metric to ESR
It is important to note that ESR only tells part of the story. Committed Use Discounts (CUDs) have inherent risk, and quantifying the savings outcome without considering this risk is helpful but insufficient.
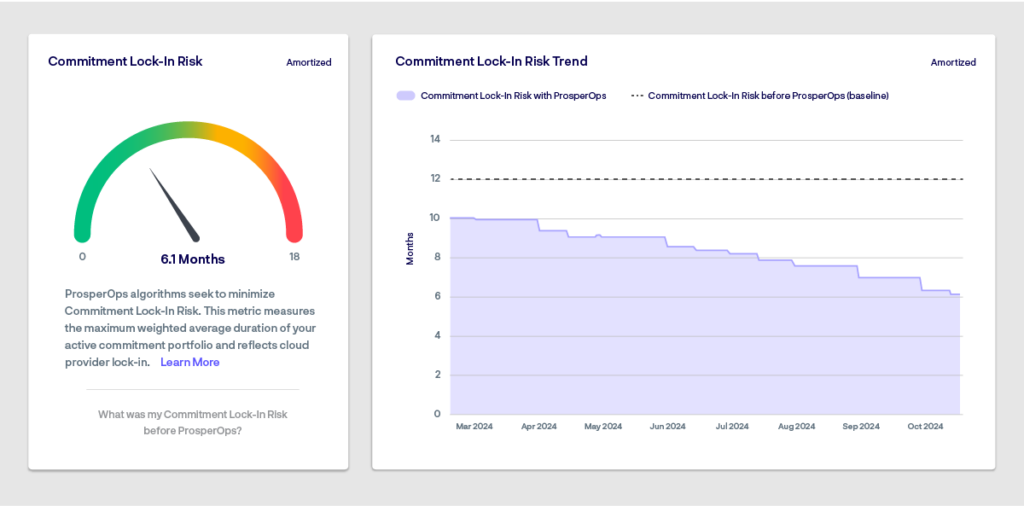
Commitment Lock-In Risk (CLR) is a companion metric of ESR; it provides a balanced view of savings performance and the corresponding lock-in risk to achieve that outcome. FinOps automation platforms should optimize for both ESR and flexibility. Savings without flexibility create risk, so ProsperOps algorithms leverage Adaptive Laddering and other techniques to reduce commitment lock-in risk. Customers can also visualize lock-in risk outcomes from the ProsperOps Console dashboard (below).
While this report does not discuss the specifics of Commitment Lock-In Risk, we are collecting more data and will soon write a similar report with actionable insights. Stay tuned!
Methodology
We focused on measuring ESR for Google Cloud’s compute services or services that run on compute — Compute Engine, Google Kubernetes Engine (GKE), and Cloud Run. These services are supported by spend-based Flexible CUDs (FCUDs), resource-based CUDs, or both. For Compute Engine, we analyzed only vCPU and Memory resource types associated with the machine series but did not include other components, including VM licenses, SSD, and GPU.
Our analysis includes an in-depth review of hundreds of anonymized data points from Google Cloud’s Detailed Usage Cost Billing Export, including usage, coverage, ESR, and discount instruments used. This was based on a lookback of data collected in 2024. Collectively, the companies analyzed represented over $250M in annualized Google Cloud compute usage in 2024.
This analysis was limited to data collected before ProsperOps began autonomously optimizing commitments to avoid skewing the dataset with outcomes only our autonomous FinOps platform can achieve.
The ESR in this report shows an all-discounts view, including private rates, because Google Cloud Billing data does not exclude the effects of private rates in their reporting, as mentioned above. Since Google Cloud compute usage is often a key driver of private rates, we segment the data into four annualized Google Cloud compute usage segments (less than $500K, $500K to $5M, $5M to $10M, and $10M or more), which is based on the List On-Demand Rate, to make a more apples-to-apples comparison of ESR data.
Insights
Insight 1A CUD strategy can significantly improve ESR, but 40% of companies do not use CUDs
Companies combining CUDs and private rates consistently achieve higher ESRs than companies leveraging each strategy individually. When both methods are employed, the median ESR for Google Cloud compute is 45.1%.
This dual-tactic strategy allows companies to leverage CUDs for compute resources and fall back on private rates if CUDs are not applicable to the specific compute resource.
If private rates are unavailable, companies still achieve significant savings from a CUD-only strategy; the median ESR when using CUDs only is 26.8%, which can result in more substantial savings than using private rates alone.
While no strategy yields the worst outcome, it still provides some minimal discount due to the impact of SUDs on stable workloads and temporary free tier credits.

This report only examines usage of CUD instruments across Google Cloud Billing Accounts at the time when we collected data (for example, if we collected the data in November, then we have information about CUD instruments used in November but not previous months). The data shows that 40% of companies did not use resource-based CUDs and/or spend-based FCUDs.

Managing CUDs for compute efficiently can be challenging because of the complexities of tracking. For Compute Engine, resource-based CUDs and spend-based FCUDs each apply to a different subset of machine series, and this becomes more complicated as Google Cloud adds new machines.
Also, overcommitment risk is heightened in dynamic cloud environments where CUDs are immutable. The inflexibility of CUDs can lead to rate optimization inefficiencies since adjustments cannot be made easily and quickly in response to sudden changes in usage. Without a sophisticated rate optimization strategy, FinOps tooling, and automation, it is difficult to manage commitments efficiently and maximize your cloud ROI.
Insight 2
A diversified portfolio of CUDs may yield better outcomes than solely relying on one discount instrument type
Companies may still be missing out on savings without a diversified CUD strategy. Our analysis shows that 33% deploy only resource-based CUDs versus 16% that leverage a mixed portfolio of resource-based CUDs and spend-based FCUDs.
While a variety of factors can influence preference for CUD instrument type and term, discount rate and flexibility are key drivers. 1-year resource-based CUDs are the most popular, likely because they offer a higher discount than 1-year spend-based FCUDs and allow for more flexibility than 3-year resource-based CUDs.
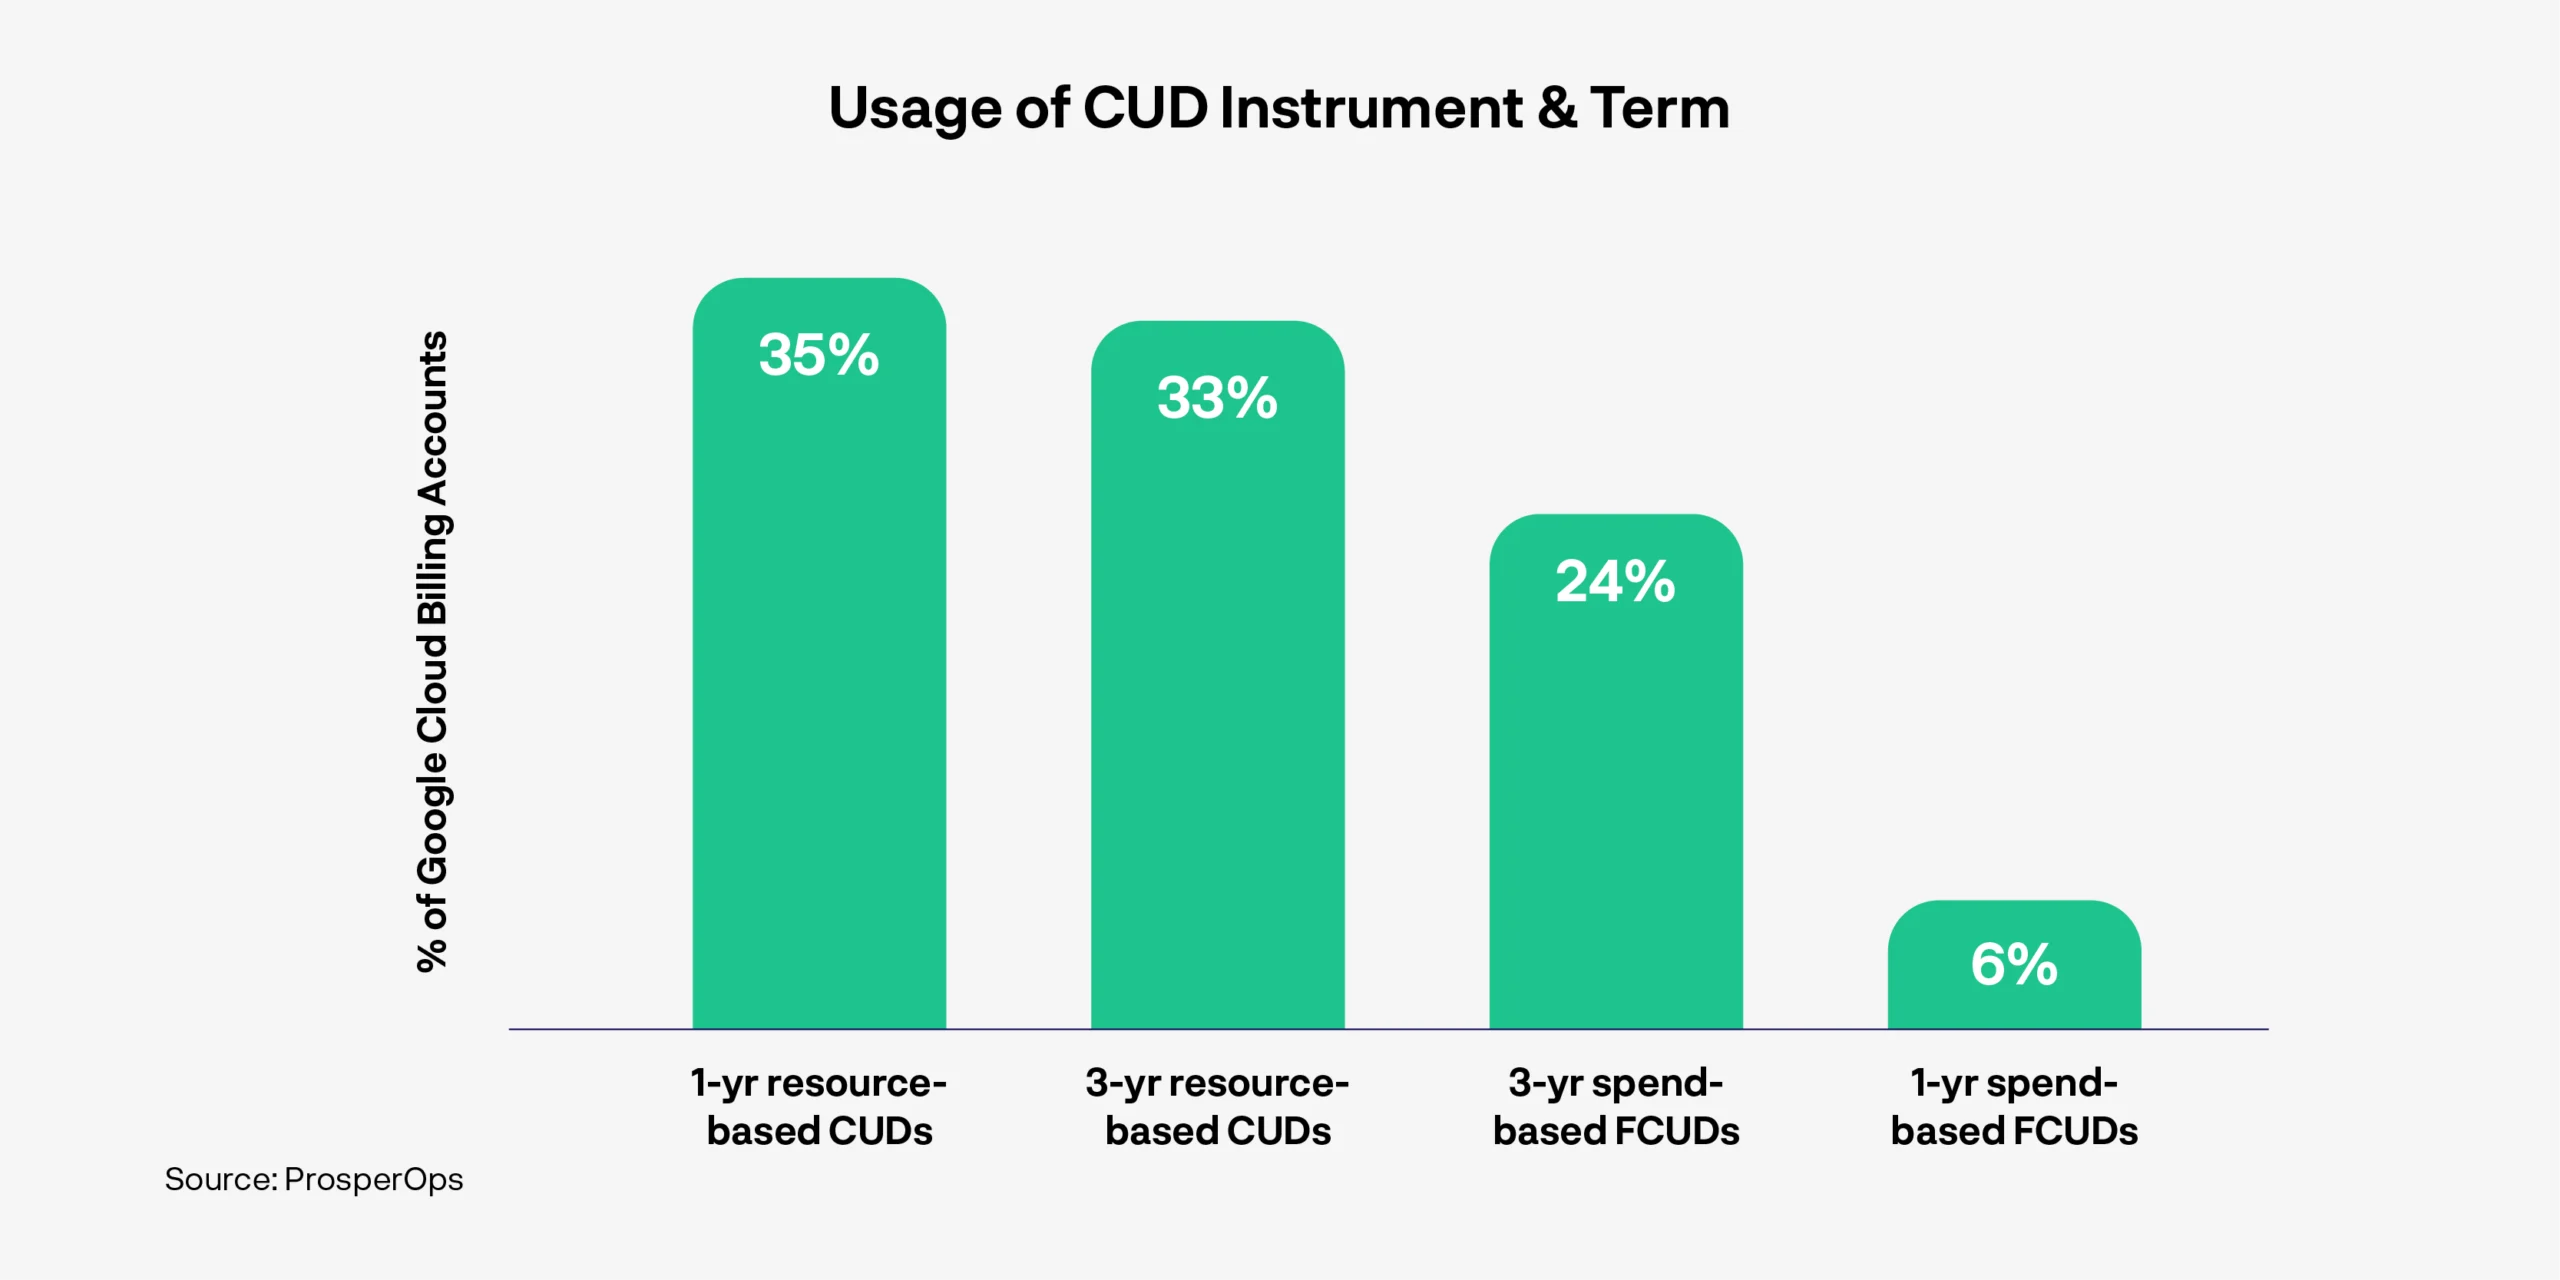
3-year resource-based CUDs are the second most popular as they generally offer the highest discount rate (for example, resource-based CUDs with a 3-year term for an N1 machine series in us-east1 have a 55% discount that can be applied to resources, such as vCPUs and memory). Also, resource-based CUDs often have better negotiated rates than spend-based FCUDs, even though FCUDs can float across multiple popular machine series and regions.
1-year spend-based FCUDs are the least popular since they offer the lowest discount rate; in some cases, in which the workload is stable, SUDs can offer a better discount and more flexibility than 1-year spend-based FCUDs.
Companies must consider the discount rates and risk profiles for each type of CUD instrument and commitment term to achieve maximized savings outcomes. Like an investment strategy, an optimal CUD strategy leverages not only a portfolio of CUDs but also the right mix, which may need to be dynamically adjusted with changes in usage and business needs.
Managing such a portfolio is often difficult to do manually; each type of discount instrument has its own rules, and cloud environments are dynamic. Therefore, efficient CUD management requires automation.
Insight 3
Companies with low compute usage may struggle to improve their ESR
We found that, in general, companies with low compute usage had far lower ESRs compared to companies with higher compute usage. For example, the median ESR for less than $500K annualized compute usage was 9.4% versus 54.3% for companies with $10M or more annualized compute usage.
Less than $500K Annual Compute Spend
Although compute usage may not always have a causal impact on Google Cloud compute ESR, they are correlated. Several factors may be influencing ESR for companies with lower compute usage:
- Negotiating power for private rates — Lower-spend companies are less likely to receive on-demand private rates than higher spenders.
- No CUD strategy — Over 50% of those with compute usage less than $500K annually are not utilizing CUDs. This may be due to smaller/ younger companies having uncertain futures; the discount on compute from CUDs may not be attractive enough for these companies to take on the lock-in risk, especially if their usage is highly volatile.
- Suboptimal CUD strategy — Companies that spend less on cloud tend to implement a conservative CUD strategy. The median coverage for those with less than $500K annualized compute usage was 0% (versus 39.7% in the overall population). These companies may have highly variable workloads, so the risk of commitment lock-in outweighs the savings. Additionally, most use only 1-year resource-based CUDs to cover compute usage rather than a diversified portfolio with resource-based CUDs and spend-based FCUDs to maximize financial outcomes.
- Less resources and time — Managing CUDs manually and tracking their eligibility across dynamic environments is challenging, especially for smaller companies that may lack adequate resources, namely people and technology. Some companies maintain a negative ESR, which suggests they overcommitted and paid for unutilized commitments when their usage declined or dropped.
Companies with lower usage may struggle to consistently maximize savings outcomes without an advanced and/or autonomous CUD strategy. ProsperOps’ Autonomous Discount Management for Google Cloud Compute continuously optimizes your rates and offloads manual work, which is even more critical as FinOps functions have expanded beyond public cloud.
Insight 4
Companies with higher compute usage need to maintain high ESR and manage risk
Companies with higher usage on Google Cloud compute resources save more and consistently so. The median ESR was 54.3% for those with annualized usage of $10M or more on Google Cloud Compute. Their standard deviation was the lowest out of all segments.
$10M or More Annual Compute Spend
Three primary reasons for this correlation:
- More resources and practices focused on rate optimization — Companies with relatively higher compute usage tend to be more mature than those with lower usage. They also tend to invest in more FinOps tooling and implement more advanced cost optimization strategies, such as a portfolio-based CUD approach.
- More likely to negotiate private rates — A majority of companies with $10M or more annualized compute usage received private rates. Because most of them also leverage CUDs, their ESR is significantly higher than those in the lower usage bucket.
- Companies at stages of high growth – Their business and usage may be scaling rapidly, resulting in higher spend. This favorable and steady growth in cloud usage creates a situation where companies can keep buying discounts, cover usage aggressively, and generate a high ESR. For example, the median coverage for companies with $10M or more annualized compute usage is 74.1% (versus 39.7% of the overall population). They are also more likely to leverage 3-year CUD instruments, which have higher discounts but also higher lock-in risk.
Stacking commitments works as long as you continue to grow steadily. If growth stalls and spending is cut, or priorities shift, a drop in usage can leave you in an overcommitted state and lower your ESR, potentially into negative territory.
Achieving both a high ESR while minimizing risk is a very difficult task, especially as you would want to maintain consistent results. You also want to be able to track the level of risk you take on with CUDs over time.
ProsperOps’ Autonomous Discount Management for Google Cloud Compute is built to maximize ESR and improve the flexibility of commitments by continuously monitoring cloud usage and taking calculated actions to optimize rates. Using advanced CUD strategies, such as Adaptive Laddering, our system algorithmically manages CUDs, spreading them over time to distribute commitment risk and safely increase coverage. Our console also tracks key rate optimization metrics (e.g., ESR, Commitment Lock-In Risk or CLR, etc.) enabling customers to visualize their results.
Insight 5
Efficient CUD management requires intelligent automation
Each type of Google Cloud Committed Use Discount carries unique benefits and levels of risk, but manually managing commitments is labor-intensive work. The DIY traditional approach requires monitoring changes to usage continuously—24/7—to understand which CUDs apply to which machine series. Algorithms can perform this type of work better and faster.
The best approach is to build a dynamic portfolio managed and optimized with automation. An autonomous cost optimization platform can align your discount commitments to usage with near-perfect (99%) coverage and optimal utilization. This makes it the best method for building a dynamic portfolio across time and usage patterns. Even in environments with high volatility — sudden, planned or unplanned changes in usage — automation helps you achieve better outcomes.
If you are unsure of your ESR, sign up for a free Savings Analysis and demo with ProsperOps here. We’ll help you understand your savings performance and ESR step-by-step.
Discover your ESR and Cloud Savings Potential
Free AnalysisWhat should I do based on my ESR?
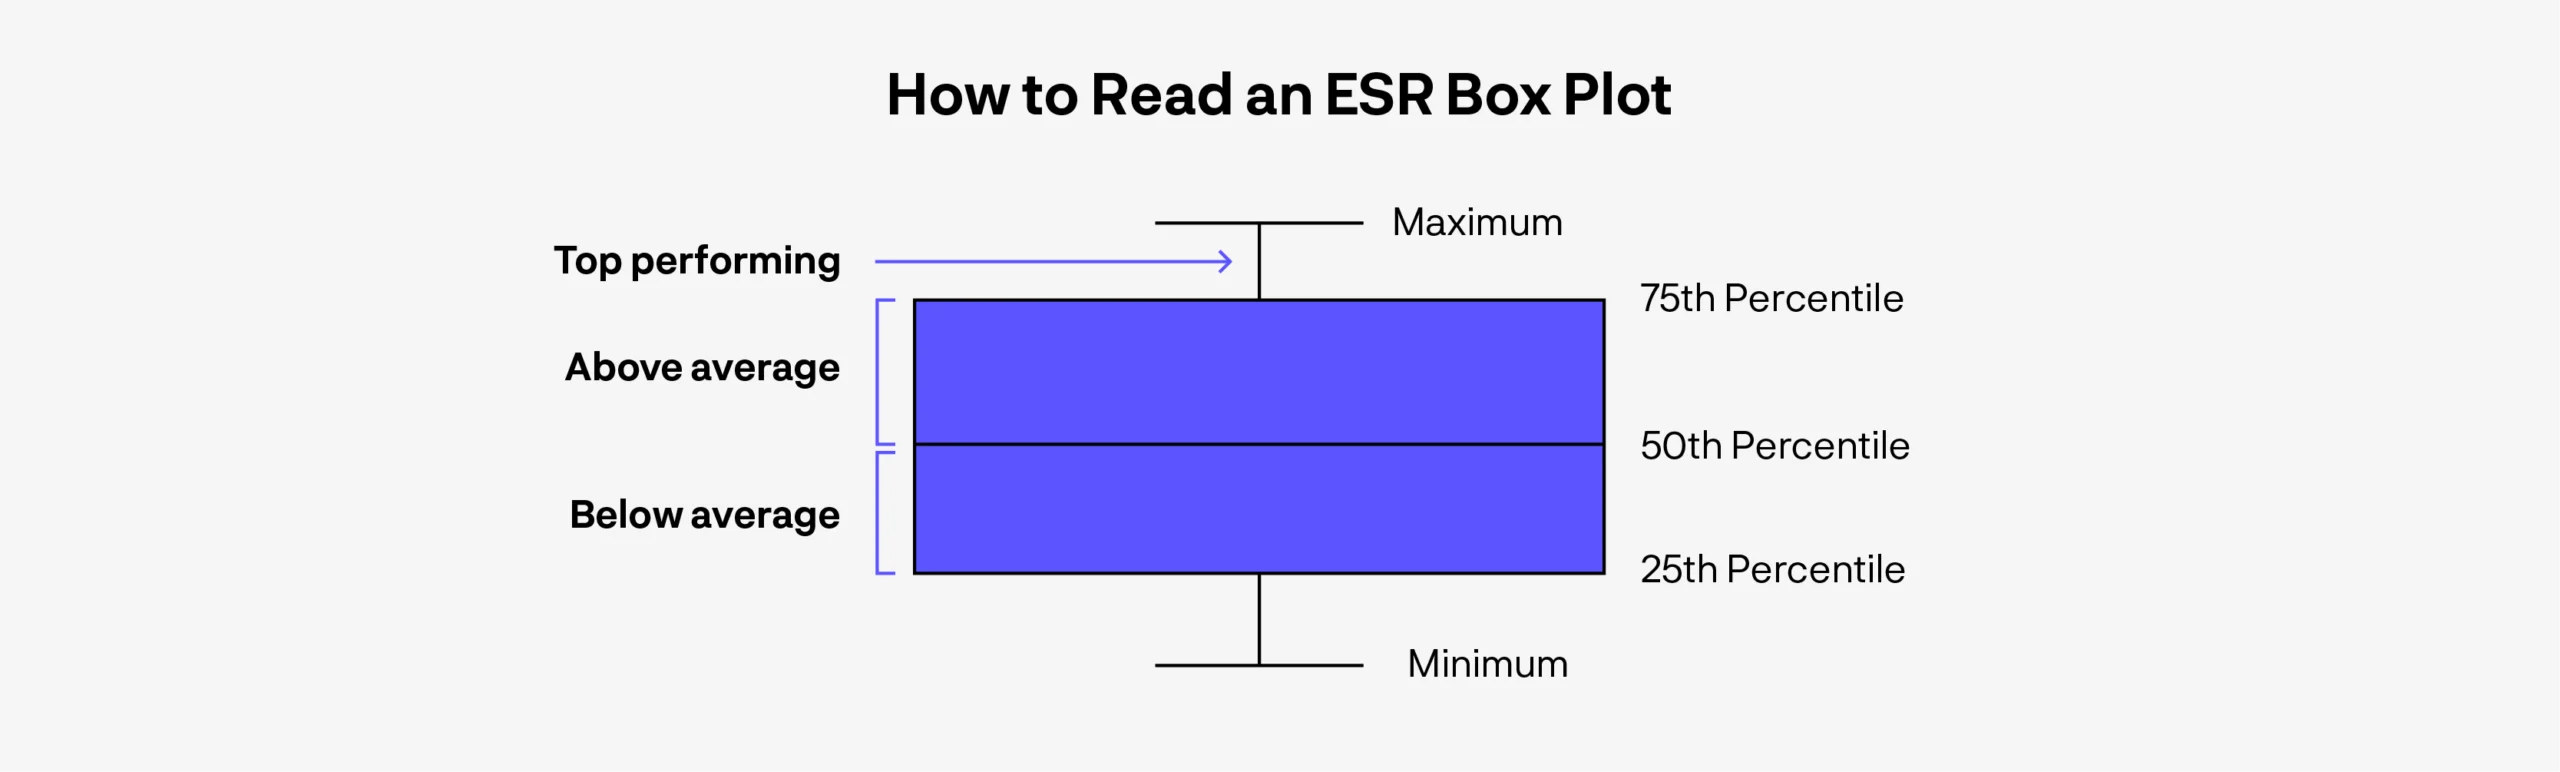
Do you know your company’s Google Cloud compute ESR? The following box-and-whisker plot segments organizations based on their annualized Google Cloud compute usage (less than $500K, $500K to $5M, $5M to $10M, and $10M or more) and monthly ESR in quartiles. This usage is based on the List On-Demand Rate or MSRP.
This chart visualizes the benchmarks for Google Cloud compute ESR performance by spend. The horizontal lines in the colored boxes represent the bottom, middle, and top quartiles (25th, 50th, and 75th percentiles, respectively), and the middle line represents median ESR. The whiskers extending vertically from the colored boxes indicate the minimum and maximum values within 1.5 times the interquartile range (IQR). For example, in the less than $500K annual compute usage segment, the 25th percentile ESR is 2.5%, the median is 9.4%, and the 75th percentile is 21.8%. The minimum ESR value is -8.9%, while maximum value is 39.1%.
Using our Google Cloud compute ESR box and whisker plot:
- First, find your annual Google Cloud compute usage segment on the x-axis.
- Then, locate your ESR vertically by identifying the closest quartile line.
- If your ESR is inside the colored box, you are within the 25th to 75th percentiles.
- If your ESR is above, you may be temporarily overperforming. Read further to understand how to maintain a consistently high ESR.
- If your ESR falls below, you are underperforming, and there is significant upside with a CUD portfolio strategy.

In which usage segment do you fit? In which quartile does your organization’s ESR fall?
Based on your quartile, ProsperOps recommends the following to improve your Google Cloud Compute ESR:
Negative ESR (<0%)
You are paying a premium over the on-demand rate, likely due to overcommitment and/or underutilized commitments.
- If you can identify unutilized CUDs, use them; activate or utilize machines that can leverage these commitments and migrate workloads accordingly.
- Otherwise, consider unwinding commitments to resolve overcommitment by allowing your CUDs to expire.
- Avoid being in an overcommitted state in the future with ProsperOps—algorithms adapt your customized portfolio of CUDs to changes in usage, 24×7.
Below average ESR (less than 50th percentile for your usage segment)
You are likely leaving money on the table—either because you do not use CUDs or you cover conservatively (e.g., less than 50% coverage of your persistent usage).
- Consider implementing a portfolio strategy that includes spend-based FCUDs and resource-based CUDs to increase savings while building in flexibility. For example, you can use resource-based CUDs on machines for production workloads and spend-based FCUDs for agile/test workloads. Spend-based FCUDs float across various machine series and cover long tail usage to help you achieve optimal savings.
- Once a portfolio strategy is in place, consider increasing your coverage to unlock more savings
- Even if you have private rates, SUDs, or other automatic discounts, you can significantly increase your ESR by using CUDs and layering on your negotiated private rates.
Above average ESR (50th to 75th percentile for your usage segment)
Your ESR is above or close to the median for your usage level, which means there is likely remaining upside to improve your ESR. However, organizations in this group should proceed cautiously as increasing coverage without an advanced portfolio strategy may add commitment lock-in risk.
- If you already have a diversified portfolio of CUDs, ladder them by regularly and gradually adding small portions of commitment that expire on a regular, rolling basis.
- Laddering allows you to safely increase coverage while maximizing flexibility. Each expiration point provides for the opportunity to make adjustments in the commitment strategy relative to actual usage.
- However, executing a precise and adaptive ladder may require additional time and resources, on top of existing FinOps initiatives.
An autonomous FinOps solution, such as ProsperOps, can incrementally optimize ESR without requiring ongoing effort or impacting engineering, allowing you to focus on other important FinOps initiatives, where human decision-making is critical.
Top Performing ESR (75th percentile or more for your usage segment)
You may be generating a superior ESR, but remember, ESR is a point-in-time measurement and can fluctuate due to short-term changes in usage. It is crucial to both maintain a high ESR consistently and simultaneously enable flexibility (reduce risk).
- Your usage is temporarily declining — ESR may look favorable because usage temporarily dropped (perhaps because of engineering optimizations), creating a favorable impact on commitment coverage.
- A sophisticated strategy is required to maintain maximum ESR consistently. One that leverages a portfolio of spend-based FCUDs and resource-based CUDs.
- Your usage is growing — ESR is high because your usage is growing, which allows you to add or layer in long-term, immutable CUDs in the near term without risk of overcommitment. This strategy works if your usage increases indefinitely, which we rarely see in the data. If usage declines, you may be in an overcommitted state, and ESR is likely to decrease.
- Executing and maintaining high coverage, high ESR, and maximum flexibility can be complex and time-consuming without automation, especially when spending millions per month, or more. If you have a dedicated FinOps team managing CUDs, they may lack time to focus on other FinOps initiatives. ProsperOps can automatically build, manage, and optimize an adaptive laddered a portfolio of spend-based FCUDs and resource-based CUDs to enable flexibility and consistently achieve maximum ESR; all of which work alongside your private rates.
- Even a small percentage increase in ESR can mean significant monthly savings on Google Cloud. For example, increasing ESR on an annual compute usage of $10M from 54% to 59% equates to $500k in incremental annual gross savings.
This report is part of a broader analysis of Effective Savings Rate (ESR) benchmarking across cloud services. The next report in our FinOps benchmarks and insights series will cover AWS services, including compute (EC2, Lambda, Fargate) and other data & analytics services (RDS, RedShift, ElastiCache, etc.).
If you don’t know your ESR, we can help. Request a free Cloud Savings Analysis to discover your ESR and learn more about automating your FinOps program with ProsperOps.
About ProsperOps
ProsperOps is the leading autonomous rate optimization platform for AWS, Azure, and Google Cloud. Unlike other solutions that may compromise performance for lower cost, our algorithms achieve superior cloud savings without engineering impact. Our software operates silently behind the scenes, and implementation takes minutes. Results start immediately.
Without intelligent FinOps automation, companies achieve suboptimal outcomes on Google Cloud. With ProsperOps’ intelligent CUD management, customers can achieve world-class savings and ESR for Compute Engine, GKE, Cloud Run, Cloud SQL, Cloud Composer 1, Dataproc and more.
Submit this form to download our report